
While putting together my previous post about "What Really Happens to Your Package During Shipment" I decided to find out if we could calculate the speed of the truck from the rotation rate of the tires?
When I had a look at the spectrograms from these transportation recordings there seems to be a waviness of the dominant frequencies throughout the 15 minute recordings that would suggest they are related to tire rotation.
So let's try to use the vibration frequency information to calculate the truck's speed!
Truck Tire Sizes
Goodyear has a PDF on different commercial truck tires for trailers that we can use to determine the average diameter of truck tires. Tire sizes are relatively confusing to understand. There are dimensions listed in both millimeters and inches which is absolutely confounding to me! Here's a nice a article on how to read tire sizes; but I'll summarize here for Goodyear's flagship G316® LHT™ DuraSeal + Fuel Max™ tires.
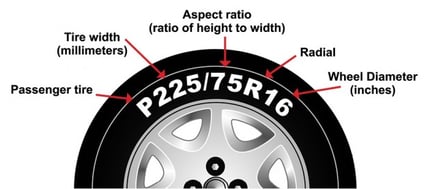
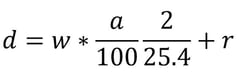
One of the available sizes is 295/75R22.5 LR-G. I highlighted the numbers that matter for calculating the tire's overall diameter. The first number provided, highlighted in blue, is the tire width in millimeters. The second number, highlighted in pink, is the aspect ratio of the tire. And the third number, highlighted in green, is the wheel rim diameter in inches. If w represents the width, a the aspect ratio, and r the wheel rim, the tire diameter (d) in inches can be calculated with the equation presented in Figure 2. The factor of 2 is needed to account for the fact that the tire height is a radial dimension; it is added twice across the diameter. This flagship tire works out to a diameter of 39.9" and a lot of the other sizes also work out to roughly 40", so let's call the average truck tire's diameter approximately equal to 40 inches.
Truck Speed from Tire Rotation Rate
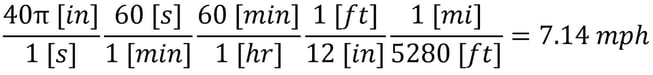
Now we need to understand what a rotation in Hertz equates to in relation to truck speed in miles per hour. Hertz is rotations per second, so first we need to determine the number of rotations per hour by multiplying by 3600. Now we need to calculate the distance each tire rotation accounts for per rotation. A circle's perimeter is equal to pi multiplied by the diameter. Multiplying 40 inches by pi and 3600 will the inches per hour; now this needs to be converted to miles per hour by dividing by 12 (inches/foot) and dividing by 5280 (feet/mile). This equates to 7.14 miles per hour as shown in Figure 3; meaning that per tire rotation rate in Hertz, a truck travels at a speed of 7.14 miles per hour.
Truck Speed from Vibration Frequency
Now let's tie it all together and have a closer look at the spectrograms from our two recording files, shown in Figure 4. Even though these recordings were from two enDAQ sensors (formerly Slam Sticks) in completely different orientations and coupling with the truck (one was UPS ground, likely just placed on a shelf; and the other was mounted to a wooden crate strapped to a truck bed), there are some blatant similarities in the spectrograms. The most obvious is the ~4 Hz frequency content being most prominent. This may be related to some structural resonance in large trucks. The second similarity is how the frequency bands appear to be spaced approximately 10 Hz apart from each other.
GALLERY - Click to enlarge images


These frequency bands are harmonics of the system's fundamental frequency indicated by their even spacing. And the spacing between each band is roughly 10 Hz which suggests that 10 Hz is the fundamental frequency of the vibration environment. From the calculation above, a 10 Hz tire rotation rate would equate to a truck speed of approximately 71 miles per hour. That sounds about right for a truck traveling on the highway!
This 10 Hz fundamental frequency is easily distinguished in the freight vibration data; but one can argue it's a bit harder to see in the UPS ground vibration data. This may be due to the poorer coupling between the accelerometer and the trucks' tires; and the general bouncing around of the box masks it at lower frequencies. But have a closer look in the middle of the recording, around 450 seconds. You'll notice the curved band there from 400 seconds to 500 seconds smack at 10 Hz. The vibration during this time may have been amplified because the truck appeared to be accelerating. This happens again at the end of the recording when it starts ramping up again, which further suggests that our accelerometer is measuring vibration directly from the tires' rotation.
So What?
Why would someone care that they can see the truck's speed from vibration data? For a number of reasons, not to mention that the analysis is fun! An engineer may be able to correlate vibration to truck speed and find some particular speed that excites a structural resonance in the system.
I remember from an engineering project a couple of years ago we had vibration issues in a rotating shaft application. I had accelerometer data from the bearing that had these periods where RMS vibration levels jumped way up! We knew it was related to the shaft's speed but it would have been relatively difficult at the time to synchronize the accelerometer data to shaft speed. But by looking at the spectrogram and knowing roughly what the dominant frequency related to shaft speed should be, I was able to develop a script that found this frequency as it moved with time. And we found that a specific shaft speed was responsible for our excessive vibration levels. This led to us recommending to our customer to avoid allowing the shaft's speed to dwell at this specific speed/frequency to minimize vibration.
A larger take-away is that there is a lot of information an analyst can discern from the raw data (click here to download data). I much prefer to have real raw vibration data as opposed to relying on some test standard. If you'd like to learn a little more about some of the analysis I ran through in this post, download our free Shock & Vibration Testing Overview eBook. In there are some examples, background, and a ton of links to where you can learn more. And as always, don't hesitate to reach out to us if you have any questions!
Related Posts:
- Get Started with Python: Why and How Mechanical Engineers Should Make the Switch
- 3 Foundational Formulas to Help You Save Time Analyzing Shock & Vibration Data
- [Webinar] Shock & Vibration Testing Overview
For more on this topic, visit our dedicated Vibration Loggers & Vibration Sensors resource page. There you’ll find more blog posts, case studies, webinars, software, and products focused on your vibration testing and analysis needs.