The short answer is NO!
At best, our results will be a repeatable but distorted view of the truth. At worst, there will only be a weak (or no) representation of reality.
Fake News Analogy
To start the discussion, let’s construct an analogy between our data acquisition process and the news we get from TV, the newspapers, and the internet. The two data paths, shown in Figure 1, are very similar in principle. At the left, we have the truth. At the right, we have the version that we see.
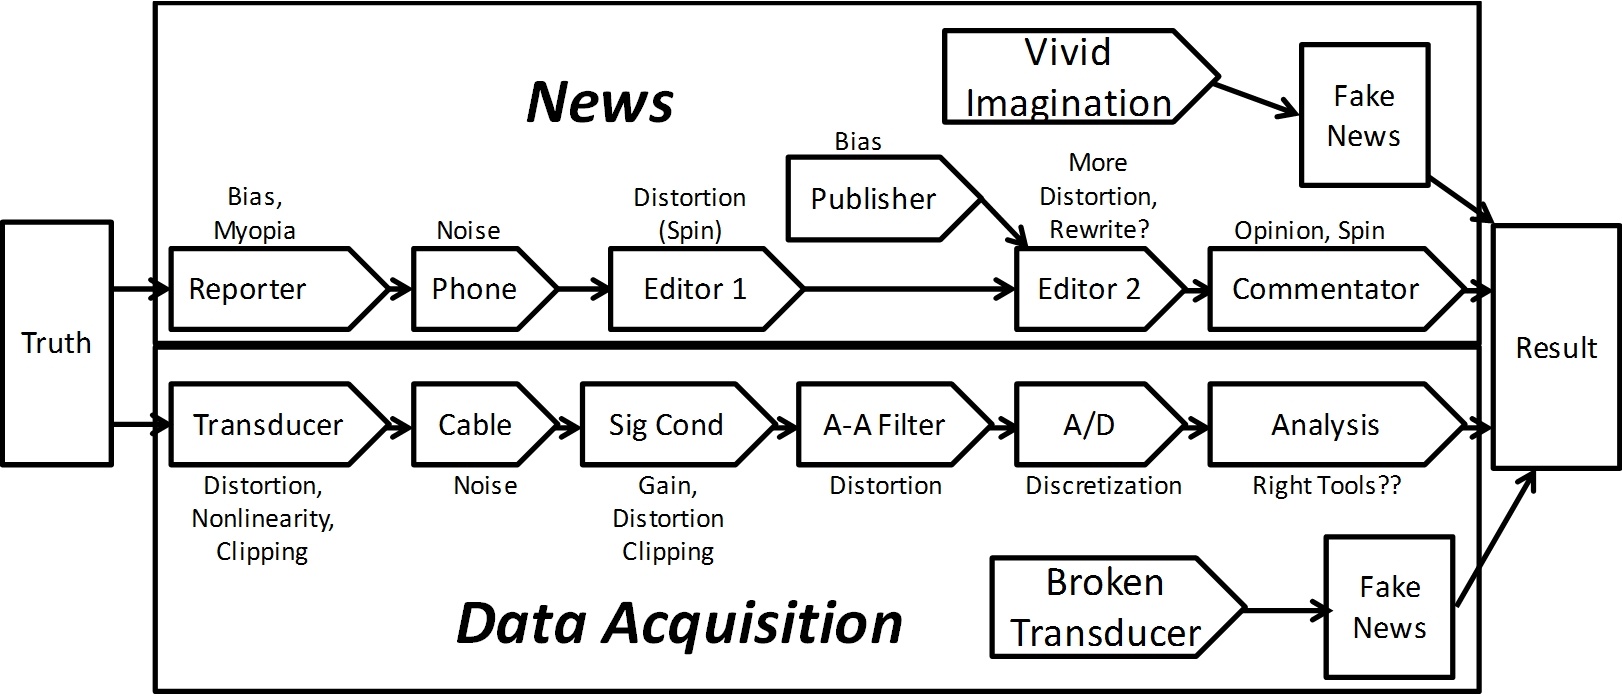
Figure 1: Just like how news reporting can distort the truth, data acquisition systems will distort the true/raw signal.
Both processes consist of multiple steps between the truth and the result. I will leave it to the reader to follow the news process to see how the results can be shifted, biased, or otherwise confused. We will look at the data acquisition process here.
The "Perfect" Data Acquisition System?
To do that, we need to discuss the differences between ideal, perfect, and real systems.
- An ideal system is one that has a constant-magnitude, zero-phase, transfer function and can acquire data forever and has an infinite bandwidth. This is physically impossible in the real world.
- A perfect system is one that behaves precisely the way we think it does. All of the involved data recording processes and transfer functions are known and repeatable. Not possible either, but we can (and do) pretend that it is what we have.
- A real system is one that has deviations from perfect including aliasing error, noise contributions, and other nasty things that we are all too familiar with.
The first violation of perfection (or ideally) is that we can’t record a signal with infinite length or infinite bandwidth. Both are limited by practical restraints (e.g. data storage and sample rate). So, already we can’t exactly measure our signal. But, that’s just the beginning.
Let’s assume we have a “perfect” system. We can emulate it because we can analytically model the data path and make up the transfer functions analytically.
Data Acquisition Distortion Contributors
Figure 2 shows a typical data acquisition data system. The signal to be measured passes through five stages: Transducer, Cable, Signal Conditioner, Low-Pass Filter, and finally, the Analog-to-Digital converter.
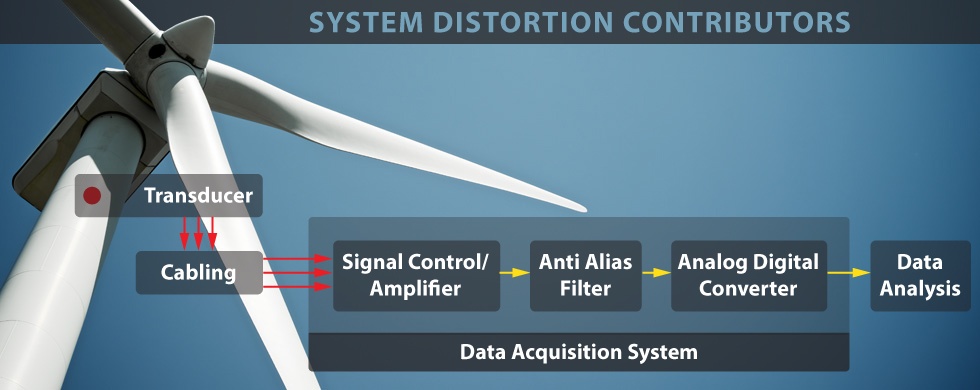
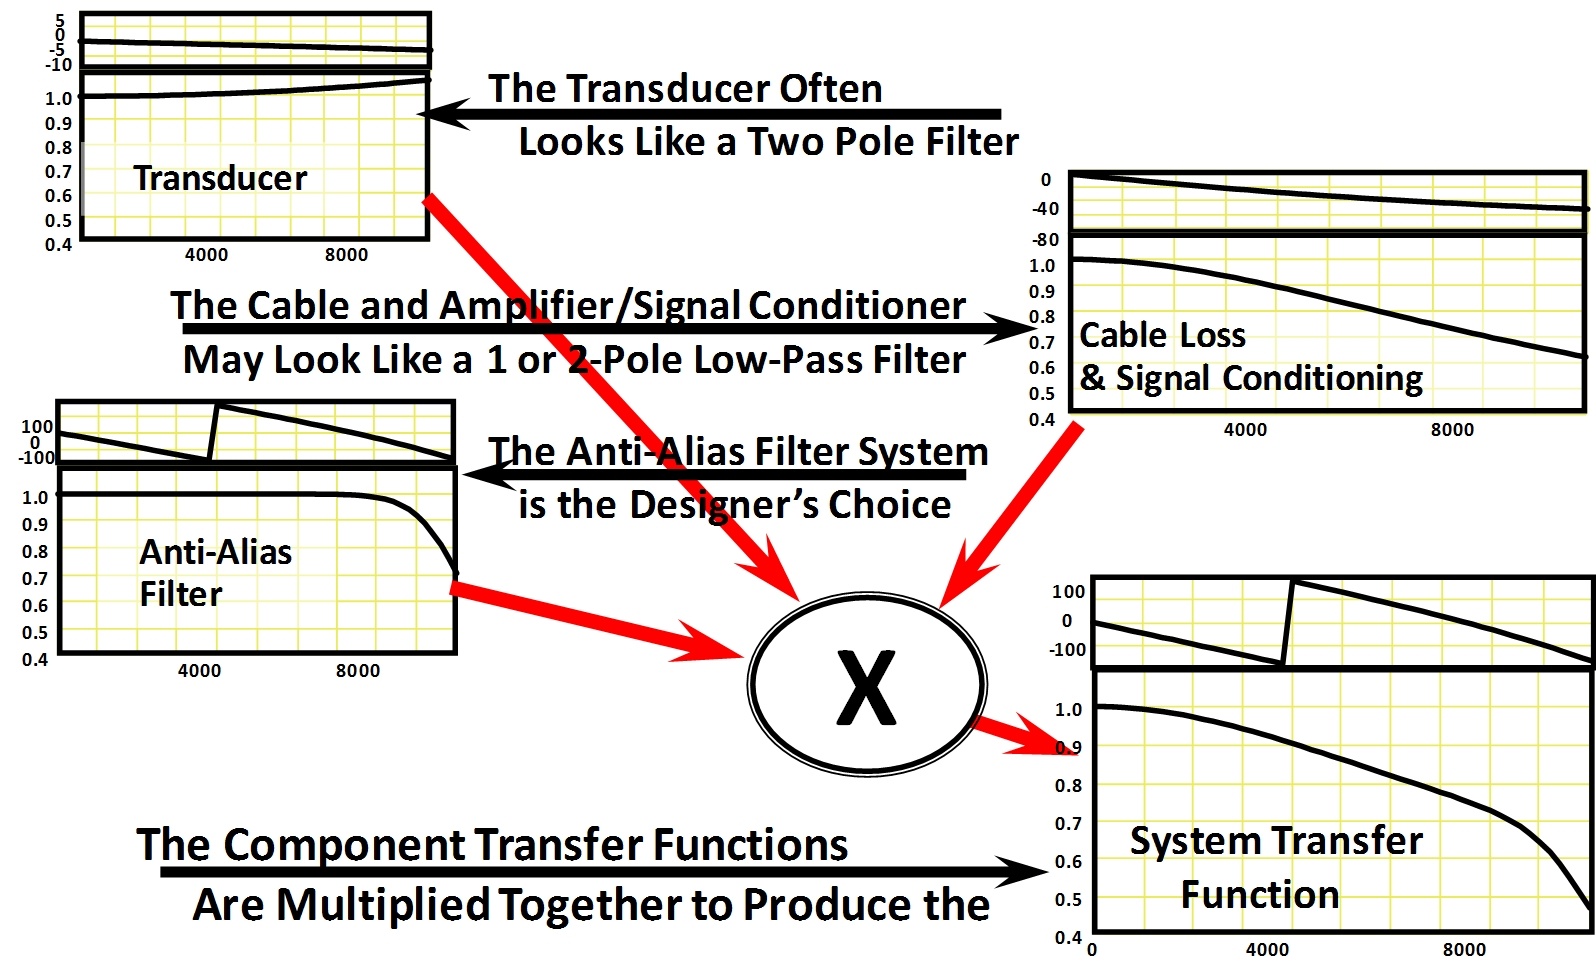
Figure 3 cartoons the effect of each of the contributors to the signal in the form of the component transfer functions. Each step changes the signal in the form of frequency-dependent magnitude modification and delay/phase shift
Raw & Filtered Data
So, let’s take a look at the result of the expected modifications to the signal.
Although all of the components are important, the low-pass/anti-alias filter is the usually biggest contributor to the signal distortion (Do we need an anti-alias filter… Most of the time: YES... The subject of a future discussion). Steve’s earlier blog showed the transfer function of several 5th order low-pass filters. Let’s see what the effect of these filters (and the sigma-delta strategy suggested in my follow-up note) is on a shock measurement.
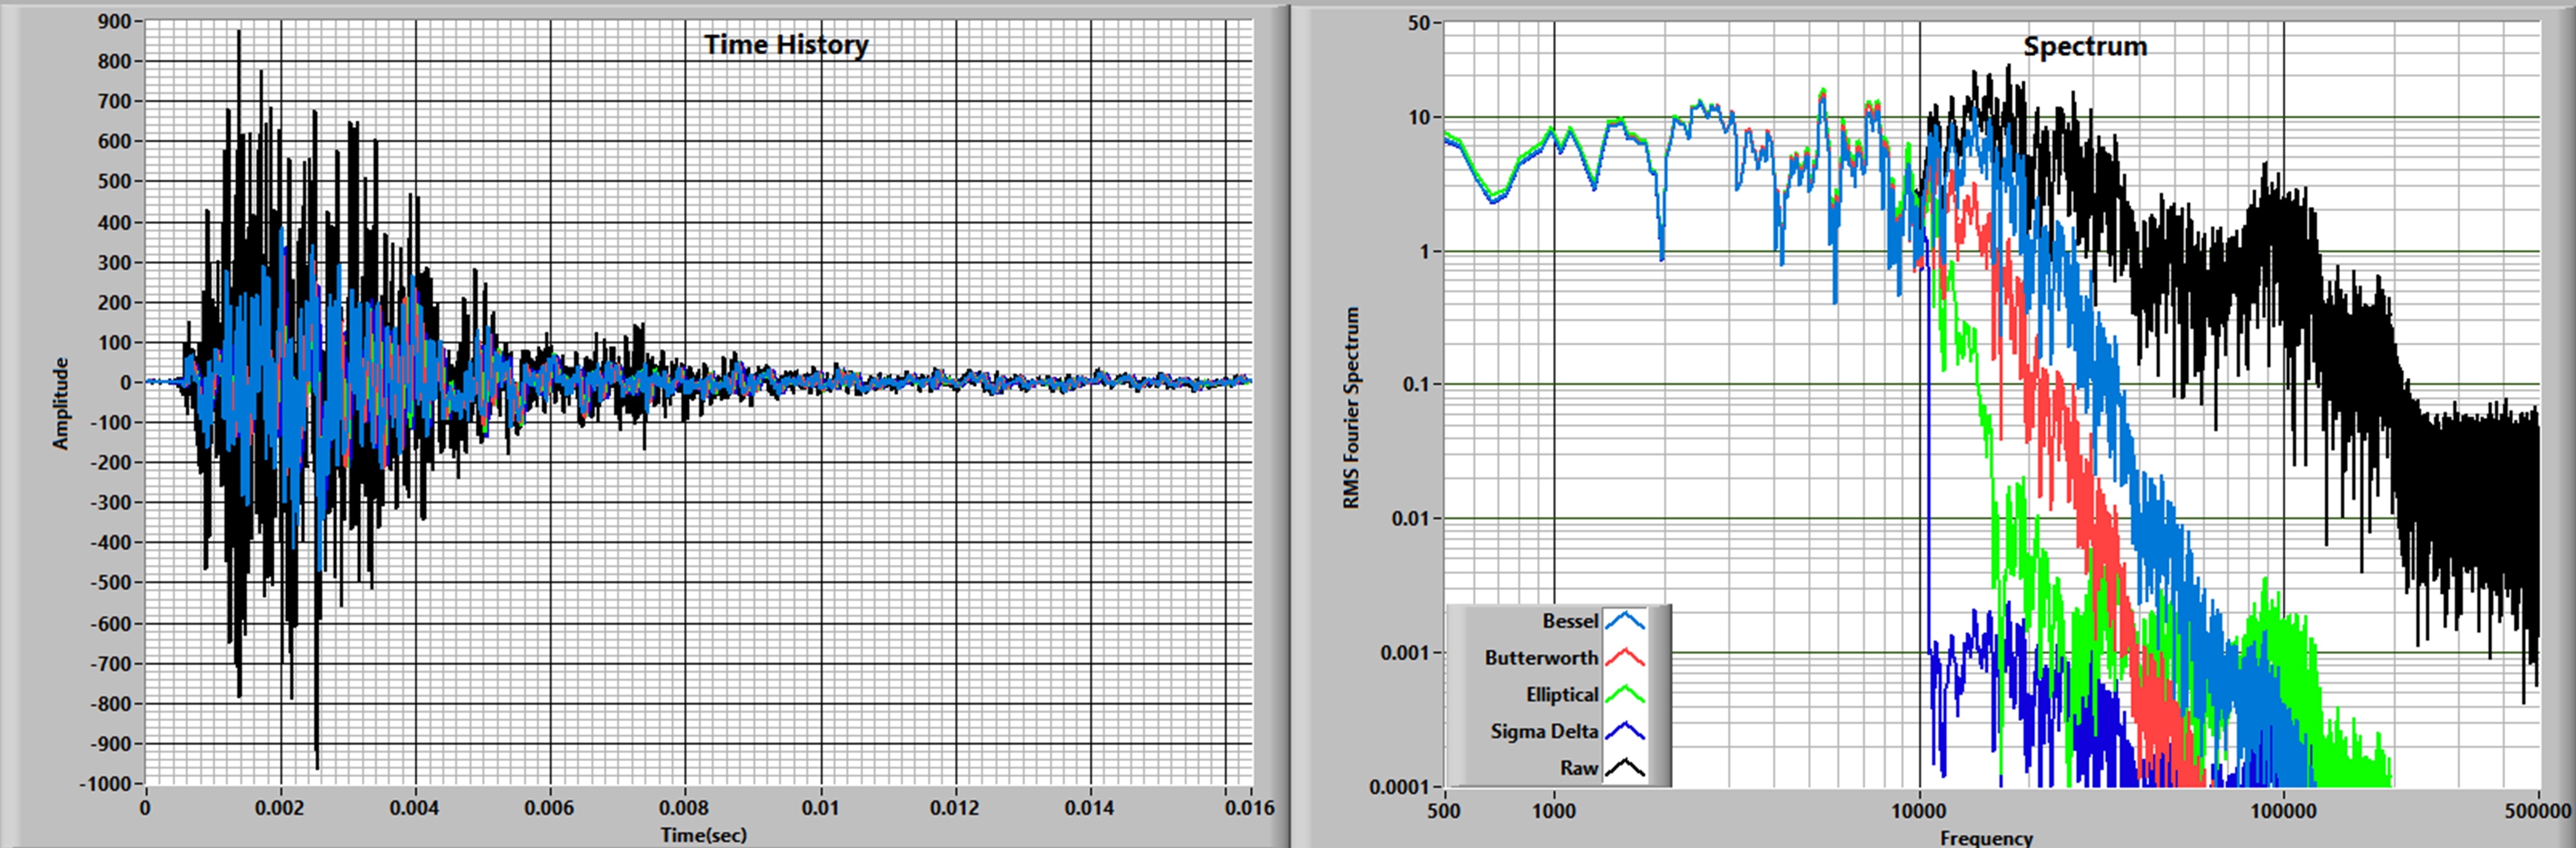
The black curve in Figure 4 shows a pyro-shock time history and spectrum acquired at 1 million samples/second. We are going to assume that it is correct. We see from the spectrum that it has lots of energy above 10 KHz. However, we know from experience that damage in real structures is usually limited to excitation below that frequency. A logical approach might be to low-pass filter the signal at 10KHz. The colored traces show the result of filtering with emulations of 5-pole Bessel, Butterworth, and Elliptical analog filters and an emulation of a Sigma-Delta (ΣΔ) digital filter. The results of applying these filters are shown in the colored traces. An expansion of the time histories is shown in Figure 5.
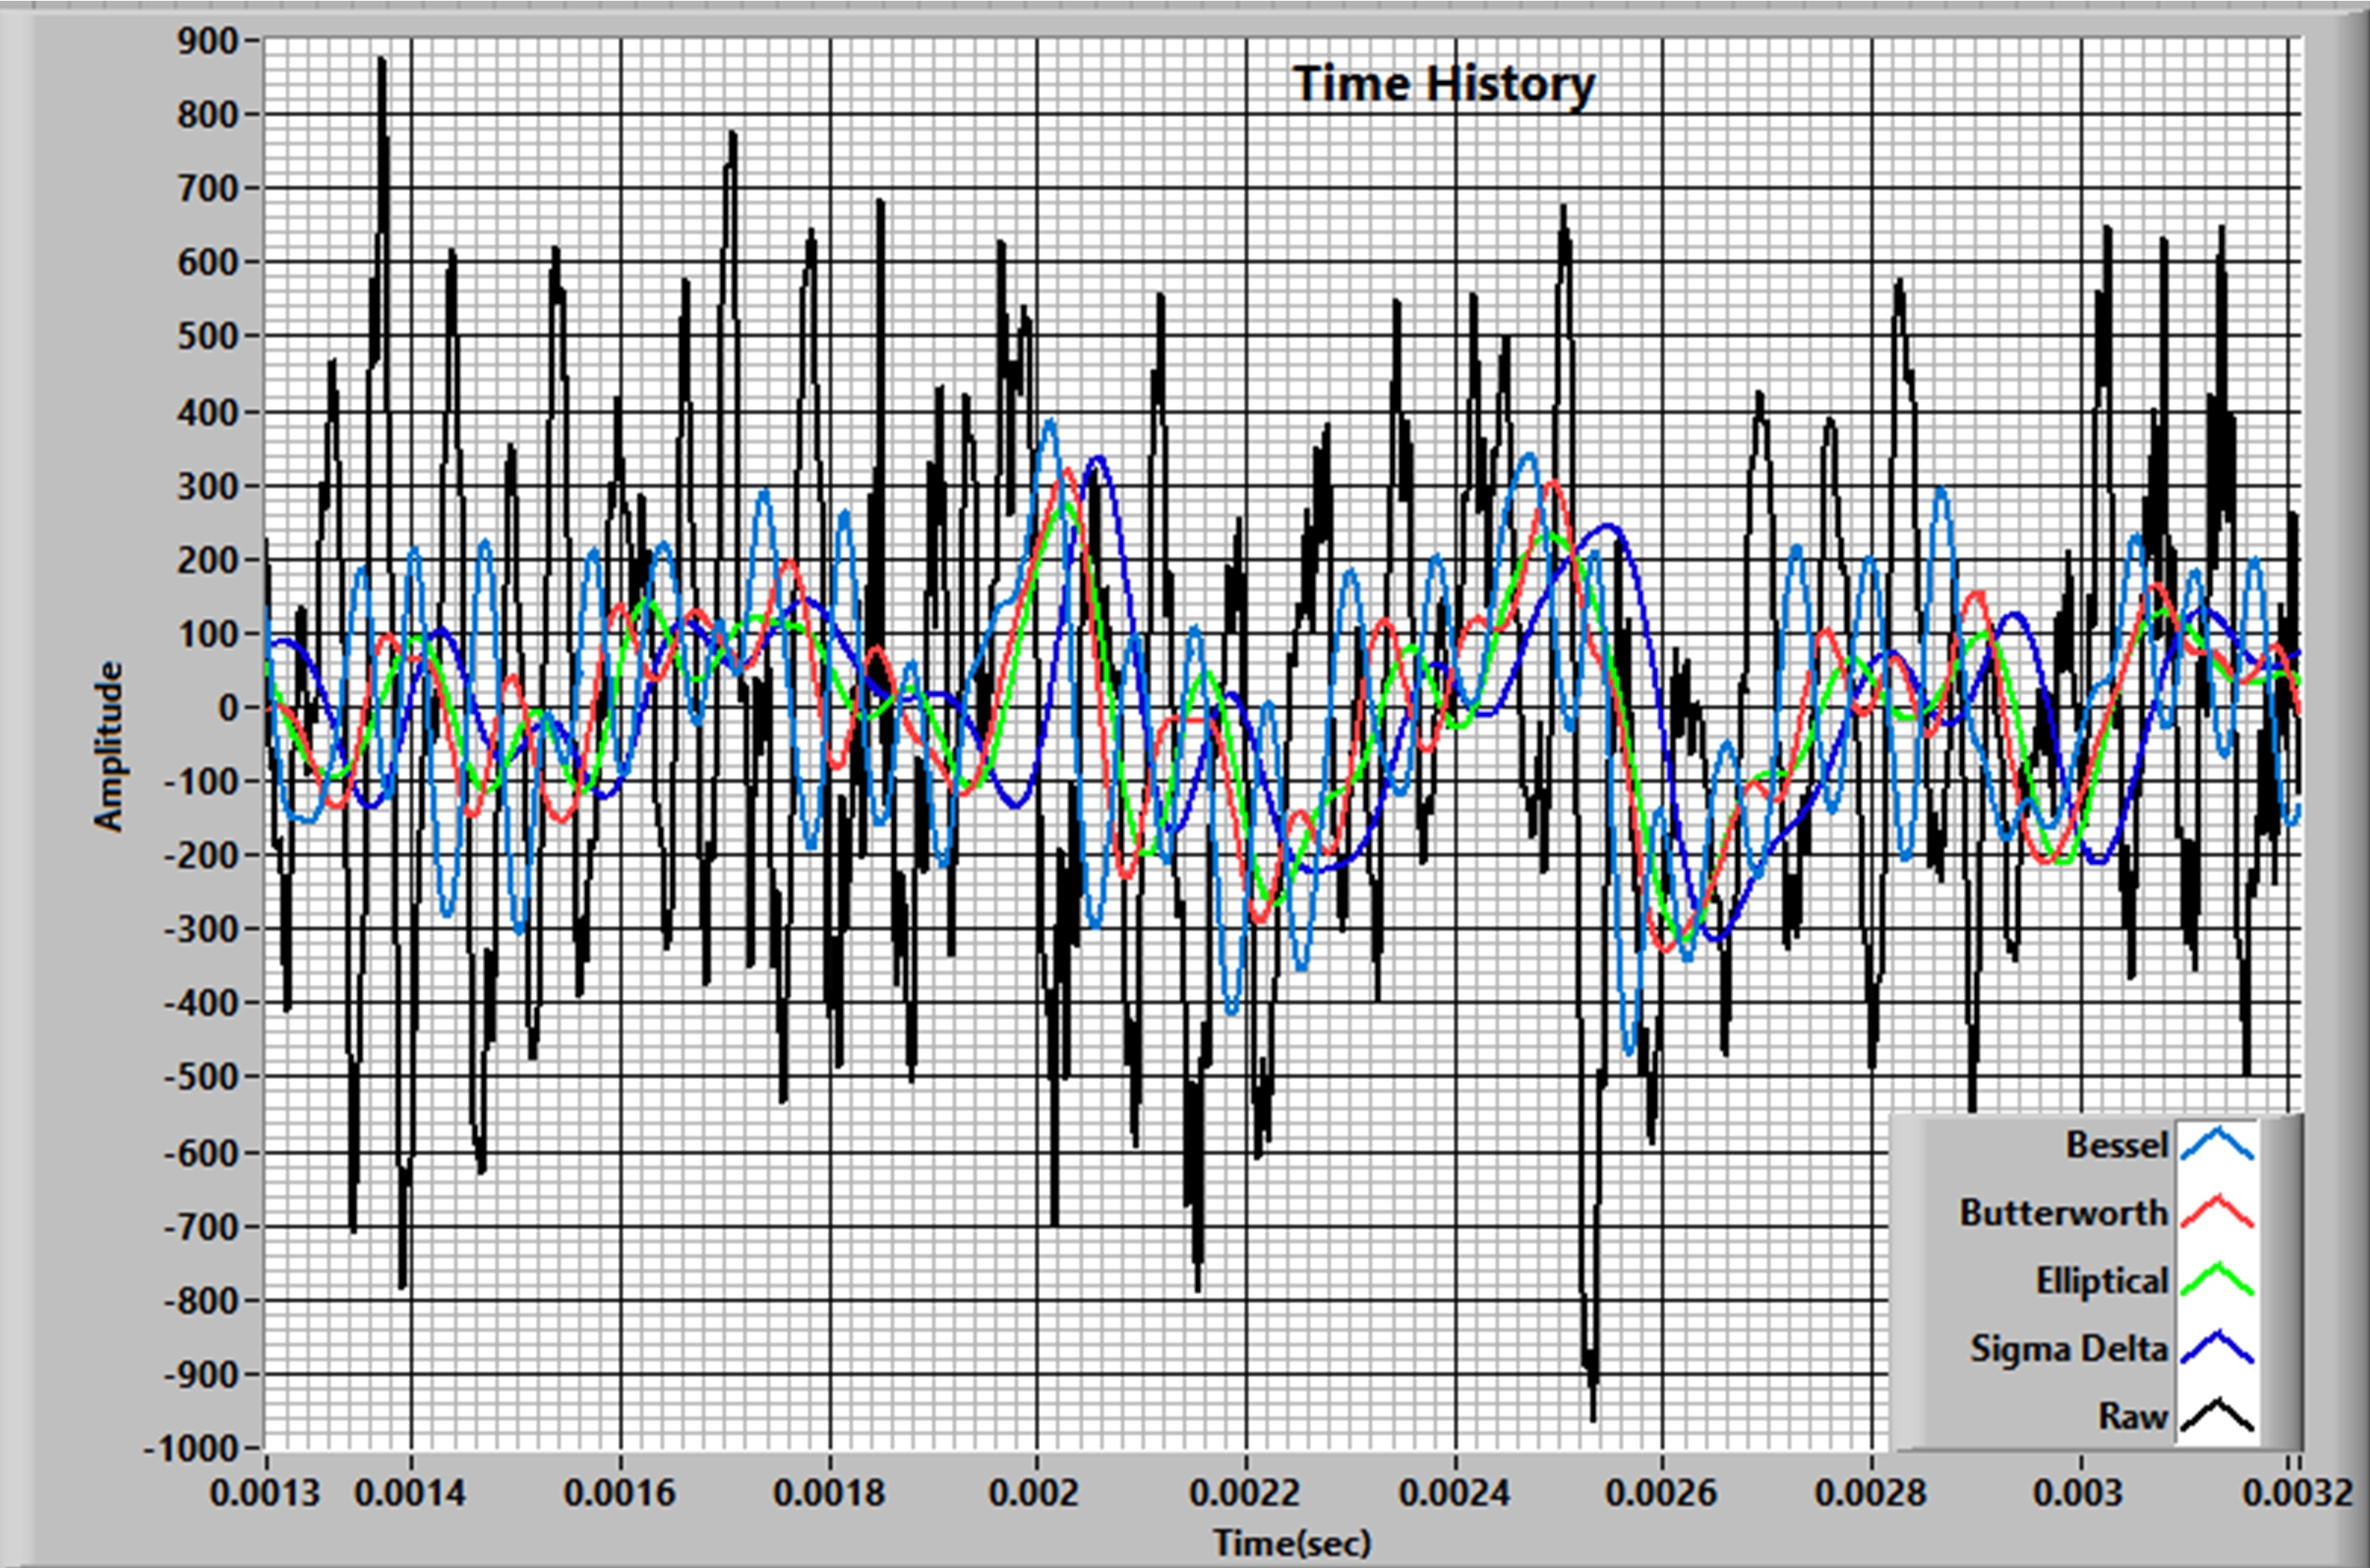
Figure 5: The raw signal (in black) is compared to different filtered signals in the time domain when zoomed in.
Obviously, the results of the various filtering strategies are significantly different (That should not be a surprise!). This is the data-acquisition equivalent of the spin and distortion found in the news analogy.
One of the simple ways to evaluate the results is to compare the Peak-Peak and RMS values of the results:
|
|
Peak-Peak |
RMS |
|
Raw |
1841 |
61 |
|
Bessel |
798 |
35 |
|
Butterworth |
631 |
34 |
|
Elliptical |
570 |
32 |
|
Sigma Delta |
642 |
33 |
Obviously, the filtered results are significantly lower than the raw truth. More importantly, there is a 40% difference in the peak-peak values between the elliptical and Bessel results (which, for this case, are the extremes). It is left to the reader to examine the spectra to rationalize the differences. (That may lead you to one of the big reasons why this writer never recommends Bessel filters.)
Conclusion
All of these results are “perfect”… The result of ideal filter processing. Which is right? None, or all, depending on your life philosophy.
The point is simple: If we are going to get consistent, comparable results, we need to always use the same filtering strategy both in type and cutoff frequency. This is not a new idea: In the 1970’s the group that was in charge of standardizing wind-tunnel test results decreed that all tests would be performed with a 4-pole, 1KHz, Butterworth filter. Is this the best choice?.. probably not.. it was chosen because it was the state of the filtering art at the time..but it produced consistent results from one facility to another.
I hope that explains the problems that we have even if our system is “perfect”. Whether our results from a real system are consistent and repeatable depends on the quality of our equipment and the care taken in the test setup... The subject of further discussions.
Send a Comment or Question to Strether

One of the reasons I've been writing these blogs is to get a discussion going. Please reach out privately to me with any questions or comments you may have.
You can participate by:
- Entering comments/questions below in the Comments Section at the end of the blog. This will obviously be public to all readers.
- Contact me directly. I will respond privately and (hopefully) promptly. If appropriate, your question could be the subject of a future blog.
This blog is meant to be a seminar... not a lecture. I need your help & feedback to make it good!
Disclaimer
Strether has no official connection to Mide or enDAQ, a division of Mide, and does not endorse Mide’s, or any other vendor’s, product unless it is expressly discussed in his blog posts.
Additional Resources
If you'd like to learn a little more about various aspects in shock and vibration testing and analysis, download our free Shock & Vibration Testing Overview eBook. In there are some examples, background, and a ton of links to where you can learn more. And as always, don't hesitate to reach out to us if you have any questions!